Please note: Dashboards are best displayed on non-mobile devices. We recommend viewing this page from a desktop or laptop computer.
Explore the hub for our essential accountability and performance metrics. Stakeholders can find key statistics, including total student enrollment, attendance rates, the district budget and the 4-year graduation rate. This resource is designed to promote transparency by hosting a District Data Profile and interactive dashboards. These data visualizations cover a range of subjects, such as academics, capacity, enrollment, finance, and school climate, allowing stakeholders to evaluate the district’s performance.
OUR DISTRICT AT A GLANCE
PK - 12 Schools
0
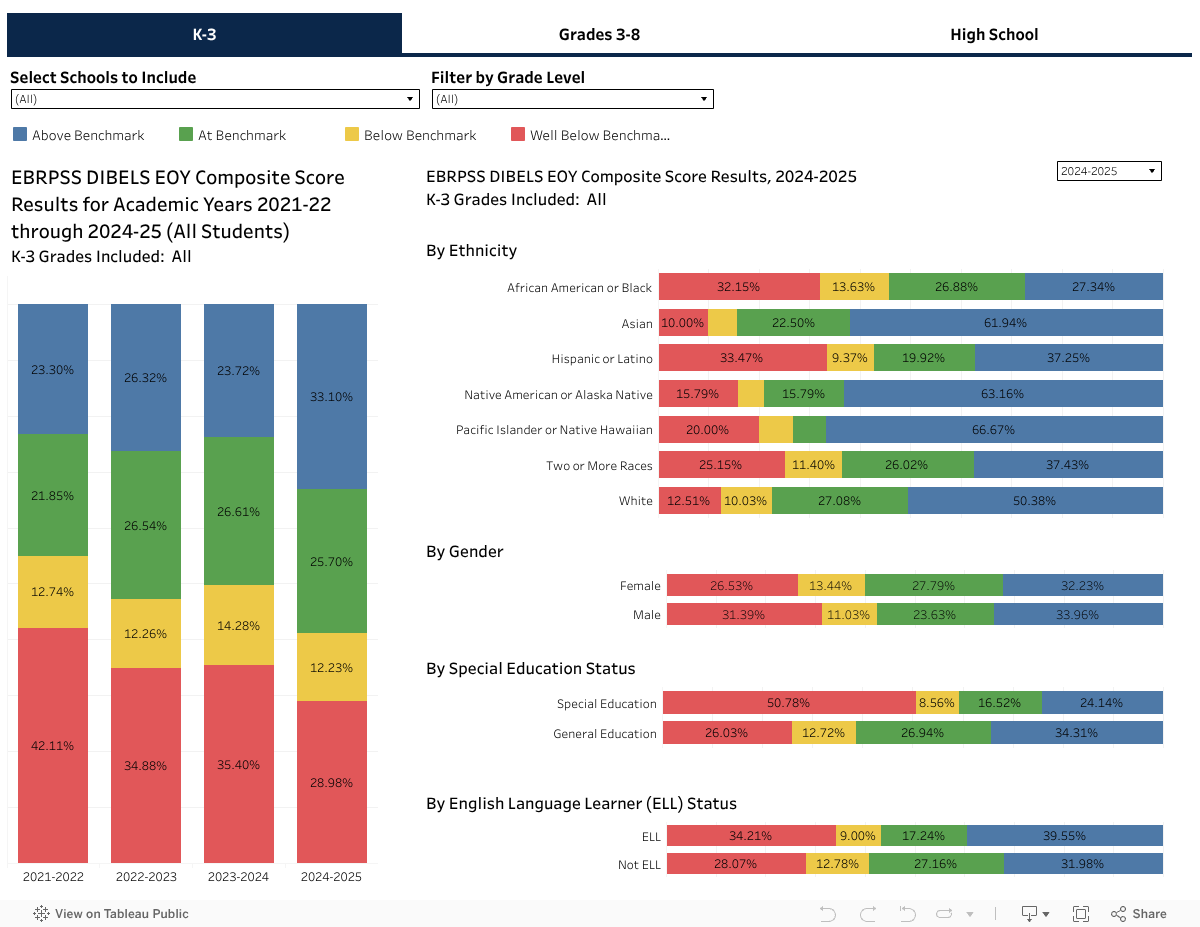
PK - 12 Enrollment
0
Attendance Rate
0%
District Budget
$0M
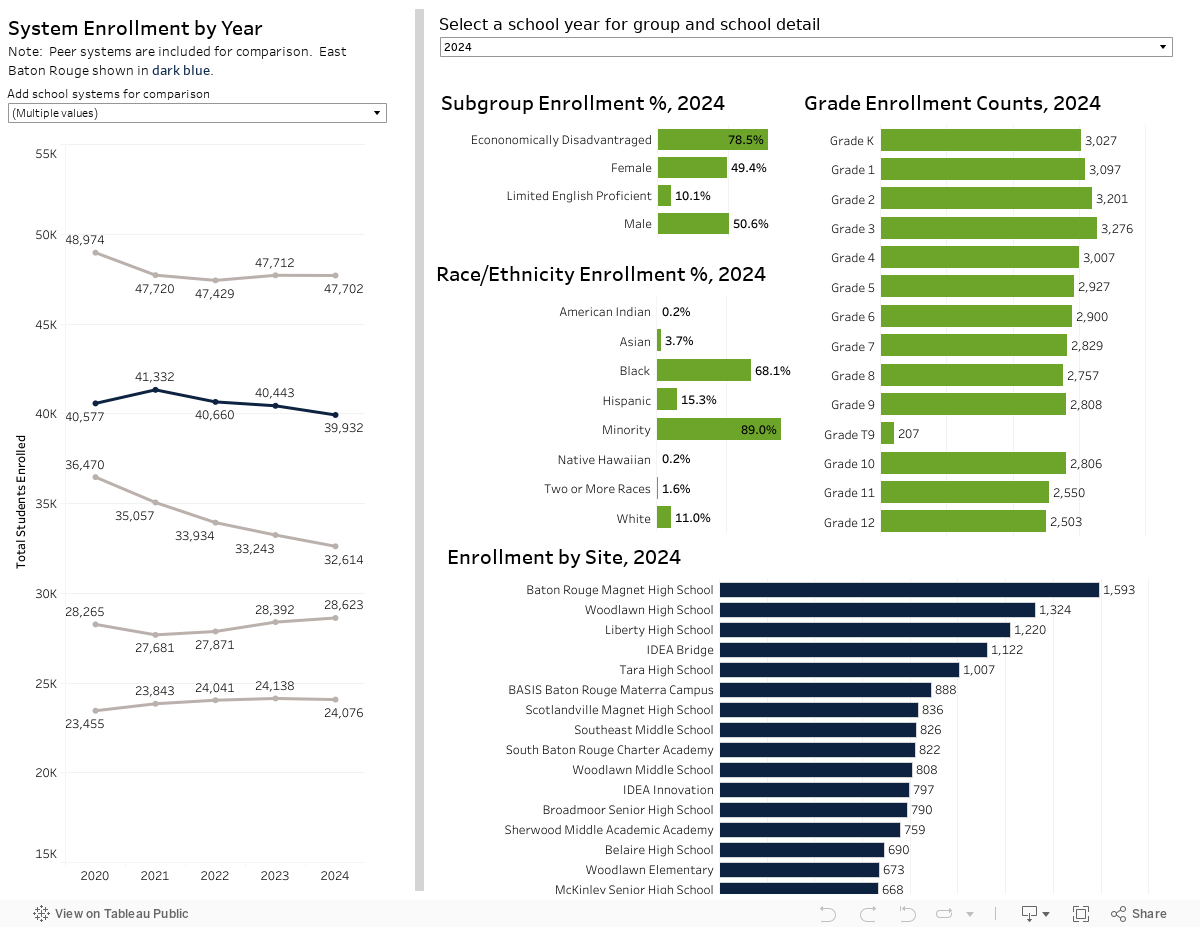
Chronic Absenteeism
0%
4-Yr Graduation Rate (2025)
0%
What Do We Strategically Track?
Student Achievement
We will ensure every child maximizes their educational and personal potential by offering robust, academic, vocational and extracurricular programs.
Key Areas and Performance Indicators
Which dashboards track this data?
District Profile
School Profiles
Academics
School Climate
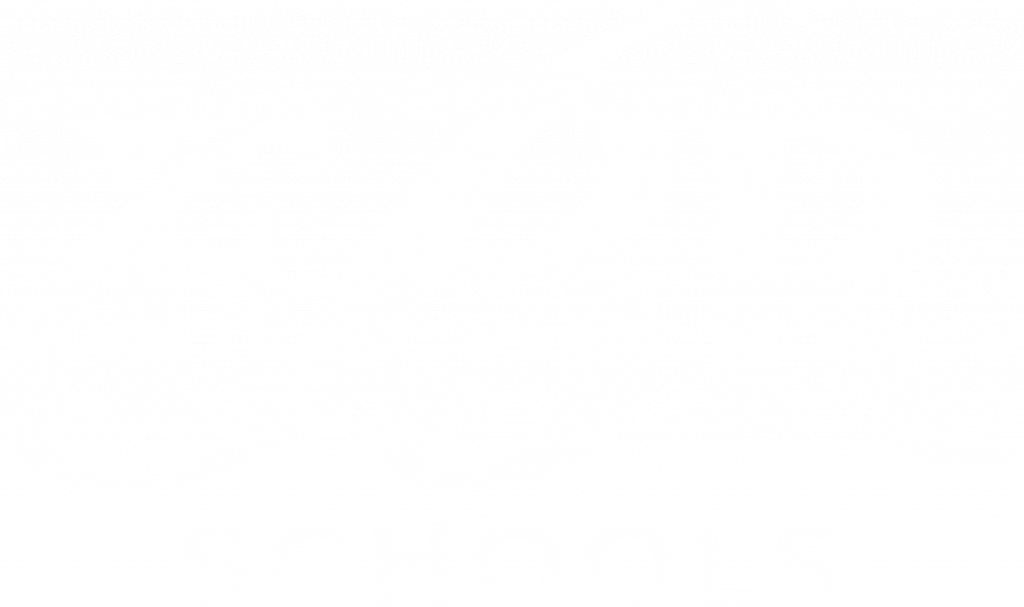
K-3 Readiness
1.1
Increase the percentage of students who score at or above grade level on K-3 DIBELS from 59% (EOY 2025) to 74% (EOY 2028)
ELA Proficiency
1.2
Increase the percentage of students who achieve Mastery and above in ELA on statewide assessments from 37% (Spring 2025) to 45% (Spring 2028)
Math Proficiency
1.3
Increase the percentage of students who acheive Mastery and above in mathematics on statewide assessments from 27% (Spring 2025) to 38% (Spring 2028)
On Time Graduation
1.4
Increase the graduation rate from 72.9% (Class of 2023) to 90% (Class of 2028)
College & Career Readiness
1.5
Increase the percentage of graduates who meet the criteria of college, career or service ready according to the LDOE’s THRIVE criteria from 19.9% (2024) to 25% (2028 SPS Release)
Attendance
1.6(a)
Increase the overall district attendance rate from 91.3% (2024) to 95% (2028)
1.6(b)
Decrease the percentage of students who are chronically absent from 30.5% (2025) to 24.5% (2028)
Operational Excellence
We will provide safe, secure and well-maintained learning environments by conducting regular assessments and proactive improvements.
Key Areas and Performance Indicators
Which dashboards track this data?
District Profile
School Profiles
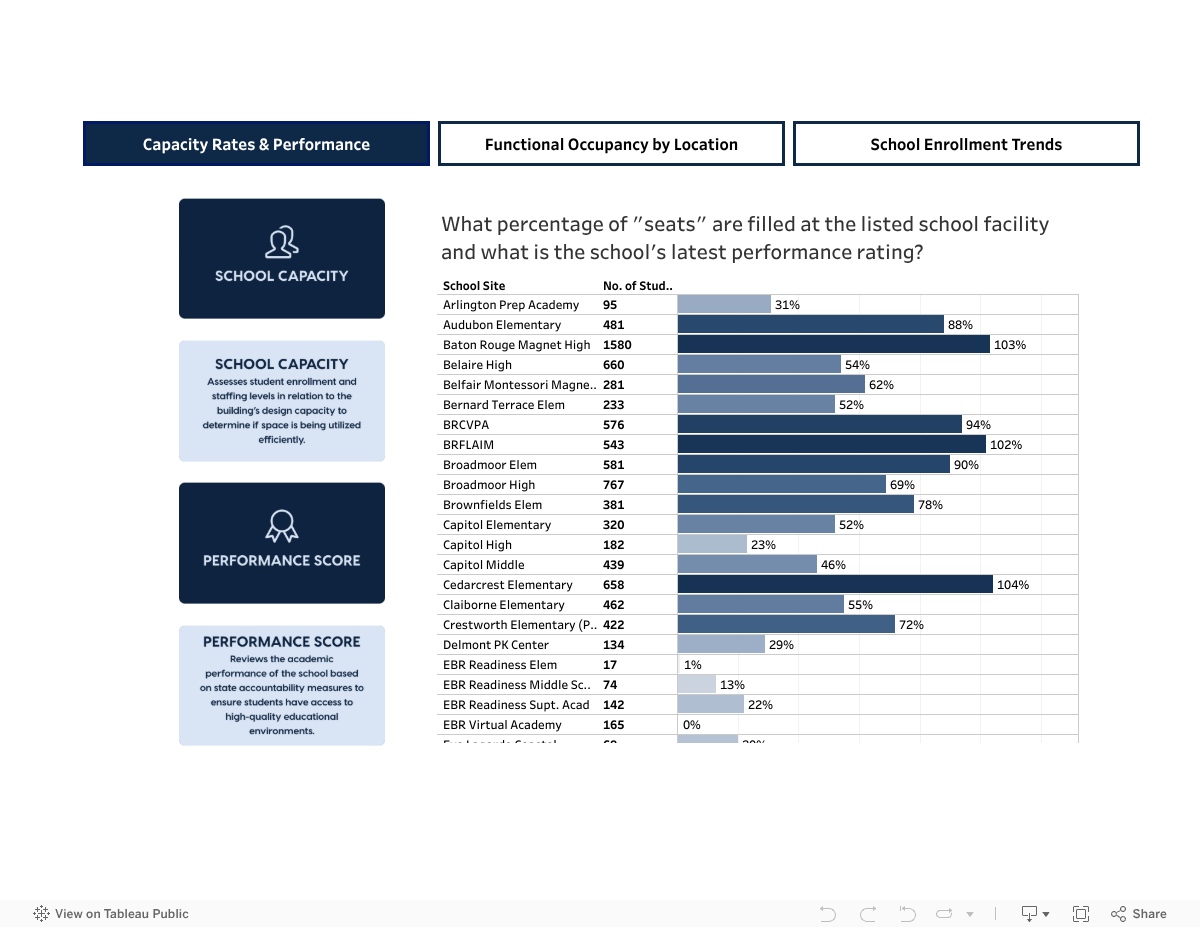
Facilities
Finance
Facilities
2.1
Increase the percentage of district facilities with a “good” rating from 29% (current) to 50% (2028)
Customer Service
2.2
Increase the average Customer Service (CX) score in Let’s Talk from 5.4 (current) to 9 (2028)
Employee Development
We will cultivate a culture of continuous growth and collaboration by fostering leadership and professional pathways for all employees.
Key Areas and Performance Indicators
Which dashboards track this data?
Compensation & State Required Learning
State Required Professional Learning
3.1(a)
Increase state-mandated K-3 literacy professional development (Science of Reading) completion rates from 67% to 100% (2028)
3.1(b)
Increase state-mandated 4-8 numeracy professional development completion rates from 54% to 100% (2028)
Employee Compensation
3.2
Increase the district’s statewide ranking for average classroom teacher salary to 10th or above (2028)
Data Profiles
DISTRICT PROFILE
An overview of districtwide performance, highlighting student achievement, attendance and overall satisfaction.
View Profile
SCHOOL PROFILES
An overview of individual schools that highlight performance, culture and operations.
View Profiles
Data Dashboards
Student Achievement
Provides access to dashboards on academic performance, student enrollment and school culture.
Academic Dashboard
Enrollment Dashboard
School Climate Dashboard
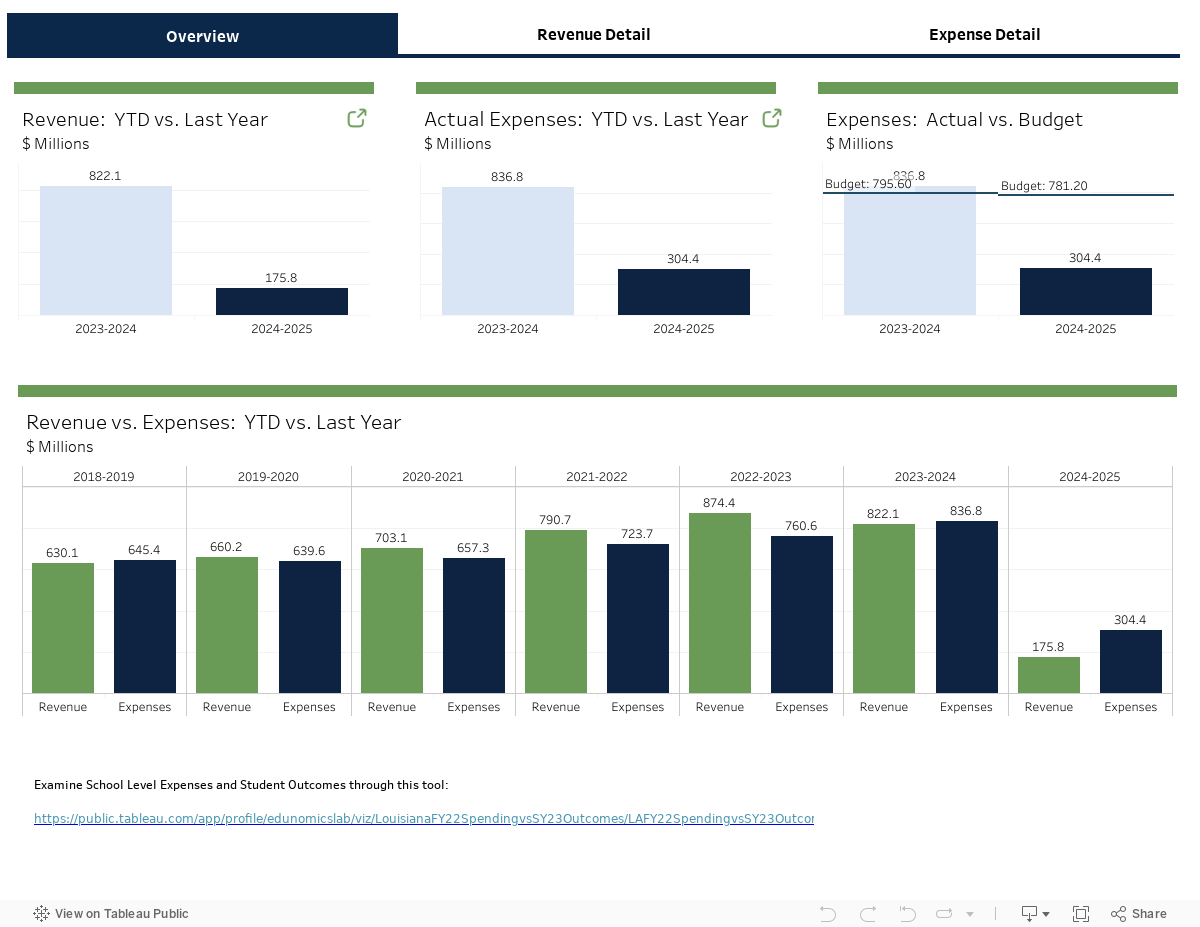
OPERATIONAL EXCELLENCE
Provides information focused on facilities and financial operations.
Facilities Dashboard
Finance Dashboard
EMPLOYEE DEVELOPMENT
Provides information on state required professional learning and employee compensation.
Compensation & State Required Learning Dashboard
This site will be unavailable due to scheduled maintenance beginning at 5PM on July 2, 2025. We anticipate the site will be restored by 8:30PM on July 2, 2025. We apologize for any inconvenience.